Aria Operations SaaS Near-Real Time Monitoring
- Brock Peterson

- Jun 10, 2023
- 2 min read
Updated: Jan 11, 2024
One of the main differences between Aria Operations and Aria Operations SaaS is Near-Real Time Monitoring for vSphere objects, which gives us the ability to pull data from vCenter/s every 20-seconds. You enable from within your vCenter Adapter Instance/s by selecting Activate next to Near Real-Time Monitoring.


As indicated by the information bubble, once enabled, you'll be collecting data from this vCenter every 20-seconds. You'll also be prompted with some dialogue around the collection process, what it means, and that you understand. Once confirmed, click OK.
You can verify Near Real-Time Monitoring by looking at the vCenter Adapter Instance's collection interval.

You'll notice you can't adjust it once Near-Real Time Monitoring has been enabled. If you'd like, you can disable Near-Real Time Monitoring in the Adapter Instance configuration, then take the Collection Interval as low as 60-seconds. If you recall, the default collection interval is five minutes, which you can take down to one minute if you'd like.
As a refresher, by default Aria Operations pulls data from vCenter/s every five minutes. vCenter provides 15 data points for each metric pulled every five minutes, one for each 20-second interval during those five minutes. Aria Operations then averages those 15 data points and saves it, this is the metric value you see in your Dashboards and Reports. The process is described nicely in this KB. Additionally, here's a nice visualization from VMware Professional Services Architect Thomas Kopton.
Keep in mind that for some of the metrics we capture, we also keep the maximum of those 20-second intervals, they are called Peak metrics and can be found/enabled in your Policies.

Peak metrics offer a cheap way to capture more granular time series data for important performance metrics on VMs, before you enable Real-Time Monitoring across the board. The original announcement blog for Peak metrics from our old friend Matt Bradford can be found here.
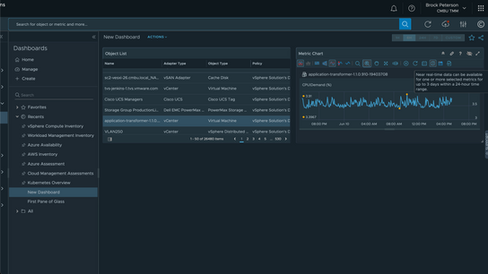
Back to Near Real-Time Monitoring, your vCenter Adapter/s will be pulling data from vCenter every 20-seconds and keeping it for three days, so keep in mind it's a 72-hour rolling window that you have the 20-second data for, we don't keep it forever. To explore it from the Summary page of a vSphere object, go to the Metrics tab, select a metric, then select the Near Real-Time icon in the toolbar.

As described, it's only available when viewing 24-hours of data, more than that, the icon won't be available. Click the icon then zoom in, like this.
You can also use the Near Real-Time metrics for Alert/Symptom combinations, like this.

Which makes it less likely you'll miss brief spikes in behavior. They are also available in 24-hour windows in Dashboards and for metric correlation.


Near Real-Time monitoring is a powerful way to capture brief spikes in your environment, use it wisely! For more information on Aria Operations SaaS Near Real-Time Monitoring, see this video on the VMware Cloud Management YouTube channel, enjoy!


Comments