Monitoring VMware Horizon
- Brock Peterson

- Feb 8, 2022
- 3 min read
Updated: May 12, 2023
For years customers have used vRealize Operations for Horizon (V4H) and the Horizon Adapter to monitor their Horizon environments. VMware recently announced that V4H is going end-of-life (EOL) in October 2022 and is recommending that customers replace V4H with vROps + Management Pack for Horizon (MP4H).
The latest release of the MP4H is 2.0, which just dropped this past week, details here:
This new management pack is a departure from the old V4H environments and allows you to converge your disparate vROps environments into a single consolidated source of truth, providing you insight into Horizon and your non-Horizon environments from a single UI.
With V4H, there was a Horizon Adapter that connected to Broker Agents sitting on the Horizon Connection Servers. The new MP4H can be run in your existing vROps environment and connects directly to your Horizon Connection Servers.

The MP4H gets installed on your vROps cluster just like any other management pack. Generally, we will configure an adapter instance for each Horizon Pod, enabling load balancing on each adapter instance to pull data from all Connection Servers in each Pod.
The MP4H 2.0 captures hundreds of metrics and objects, details found here. It also includes 30 Dashboards, 114 Views, 66 Alerts, 7 Recommendations, and 105 Symptoms. New features include:
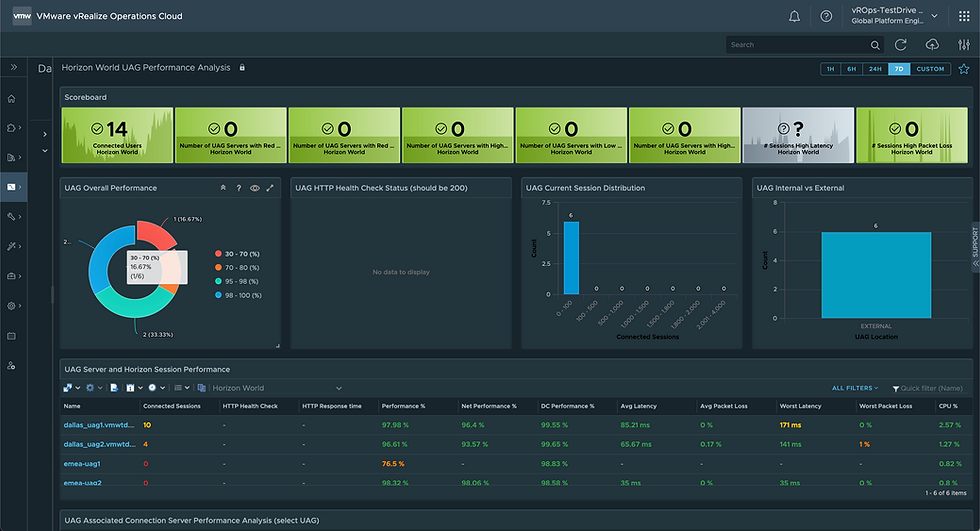
Support for Universal Access Gateway (UAG)
New metrics for user-based capacity model
Computing performance KPI from 20 second peak monitoring metrics
Flag for automatic clean-up of sessions and user objects
Enhancements to Horizon Traversal spec
Configuration of Telegraf Agent monitoring for Connection Server and UAG
There is now a dedicated dashboard for UAG performance, instantly telling you which UAGs aren't performing, UAG Session Distribution, and underlying Session performance.

The UAG object has its own Summary Page as well, providing details at a glance.

From an Infrastructure perspective, there are several Dashboards to use, but let's start with the Horizon Getting Started Dashboard.

At a high level you can see how many Pods, Users, RDS Farms, Applications, VDI Pools, and Desktops, including Error Desktops. Providing a nice summary, the Getting Started Dashboard allows you to quickly determine the health of your Horizon environment.
The Horizon World Overview Dashboard is also quite good from an environment summary perspective.

Showing critical issues across the top, it also shows the the most used VDI Pools and RDS Farms using the Top-N widget, allowing the user to quickly determine which VDI Pools and RDS Farms might need more resources.
If you're looking into your Horizon Connection Servers specifically, you should explore the Horizon Connection Server Performance Dashboard.

MP4H provides insights into your Users, Sessions, and Desktops as well, while keeping historical data for these objects and metrics. Starting with the Horizon User Troubleshooting Dashboard:

It allows you to search for the User (or select Users in the Donut Chart or the Top-N widget), quickly determine which VDI Sessions that User is using, and determine the related CPU and Disk metrics for them, along with Alerts.
The Horizon RDS Session Performance Dashboard allows you to select an RDS Farm, see all RDS Sessions in that Farm, and quickly determine is that RDS Session is having any issues, including network latency, packet loss, and more.

In addition to the Dashboards, the MP4H includes 65 Alerts for things like:
VDI Sessions and RDS Sessions experiencing high protocol latency
Application Sessions experiencing packet drops
POD communication failures
Notification Events sent from Horizon constructs themselves
vROps + MP4H 2.0 is the most advanced monitoring platform for VMware Horizon. For more information about these solutions reach out to your VMware representative!
Comments