VCF Operations Telegraf Agent Health
- Brock Peterson

- Feb 15
- 1 min read
I'm running Telegraf Agents on some VMs in my environment and wanted to see their status without going to the Workload Operations - Applications - Manage Telegraf Agents page. Here's what I did.
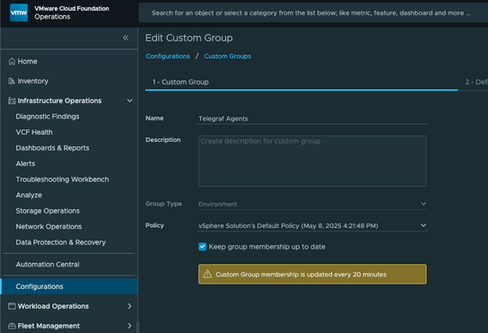
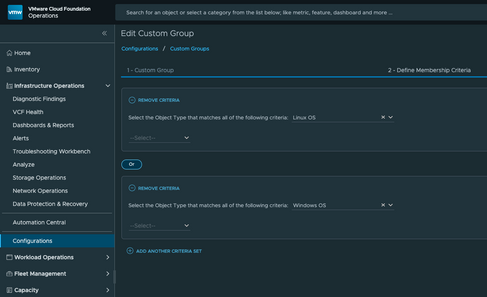
I first created a Custom Group containing all Telegraf Agents I could use with Dashboards and Views.


I then created a Super Metric against Object Type Environment (same as my Custom Group) summing up the number of Healthy Telegraf Agents. It looks like this.

I'm basically summing up the total number of Telegraf Agents that have an Availability value of 1. If you'd like this Super Metric you can get it here. When Telegraf Agents are down the value of the Availability metric will be 0.
Using this Custom Group and Super Metric in a Dashboard I came up with this.

As you can see I have 5 total Telegraf Agents and 4 of them are healthy. The unhealthy one is the Telegraf Agent on the "mongodb-8-1" VM. One thing to note here is that when the entire VM itself is down, it will look like this.

Notice the Telegraf Availability still shows as "1" even though the VM it's running on is down. I suspect this is simply the last data pull before the VM went down, but opened an internal inquiry as it's confusing. If you'd like this Dashboard you can get it here, enjoy!
Good Day All. I would like to ask. How can I create a custom group of all VMs with a managed telegraf agent? I created a custom group of managed telegraf agents based on a VM Tag. But is there an other way?
Thanks for the great Dashboard advice! Is there a way to have this for Log Agents Health too?