VCF Operations Workload Widget
- Brock Peterson
- Oct 22, 2025
- 1 min read
If you've been using VCF Operations for a while you've likely come across the Workload Widget in a Dashboard, it looks like this.

It will provide the CPU Workload % and Memory Workload % of the Object it's configured to show. Here I've told mine to show CPU and Memory Workload Metrics for Cluster vcfops01.


As shown, beyond that, there is nothing else to configure. If you look at the Cluster itself, you can see the metrics being displayed.

As shown, CPU Workload % is at 11.57% and Memory Workload is at 22.57%. The Workload Widget rounds those up to 12% and 23% respcetively.
But what is CPU Workload %? If you hover over the metric in the Cluster Metrics tab you'll be given a description.

So, CPU Workload % is CPU Demand / Usable Capacity. For my Cluster that looks like this.

Zooming in on the metrics we can see the values.
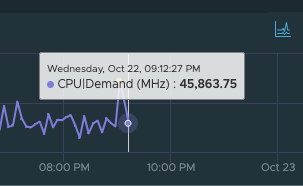
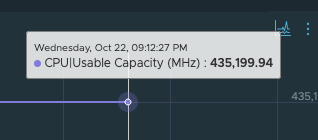
(45863.75 / 435,199.94) x 100 = 10.5 (rounded up to 11% in the Workload Widget)
Doing the same for the Memory metrics gives us this.

Zooming in on the details shows this.
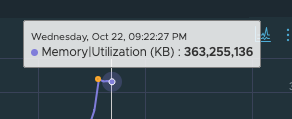
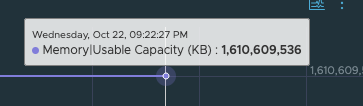
(363,255,136 / 1,610,609,526) x 100 = 22.5% (rounded up to 23% in the Workload Widget).
I adjusted my Dashboard to show the Workload Widget along with a List View highlighting the metrics being used, hope this helps!
