Monitoring vCenter Services with Aria Operations
- Brock Peterson

- Nov 28, 2024
- 2 min read
Updated: Nov 13, 2025
The SDDC Health Management Pack gave us some visibility into vCenter Services, but it wasn't super intuitive. The VMware Infrastructure Health Management Pack gave us more, but Aria Operations Diagnostics (introduced in 8.18) is the latest evolution in monitoring vCenter Services, and it's the best yet, let's explore!
If you're running Operations 8.18 or beyond, you will notice Diagnostics, which brings visibility into all sorts of different items, vCenter Services being one of them.

I'm showing no vCenter Service health issues and all vCenters appear to be available (pingable), clicking VIEW DASHBOARD will give us more details.

If you're not showing vCenters and all their Services, confirm you have the prerequisites in place, which are detailed here. You'll also need to follow the instructions in the Note listed here. You need these prerequisites in place locally on each vCenter, even for those in Enhanced Linked Mode.
The vCenter Appliance List View shows the vCenters you're pulling data from along with four metrics, let's edit the widget to see where they're coming from.
The first pane indicates the View is a self Provider. The second pane indicates Universe object types, which tells me these object aren't being created by the vCenter adapter. The third pane defines the View itself, in this case vCenter Appliances, let's explore.
The first pane configures your View, the second pane sets the object types (vCenter App) and defines the metrics/properties to be shown. You'll notice 2 of them are using the Expression Transformation to define Reachability and Average Over Time as percentages. You'll also note in step 3 the Relative Date Range is 7 days, which defines the data range being used for the Average Over Time expression.
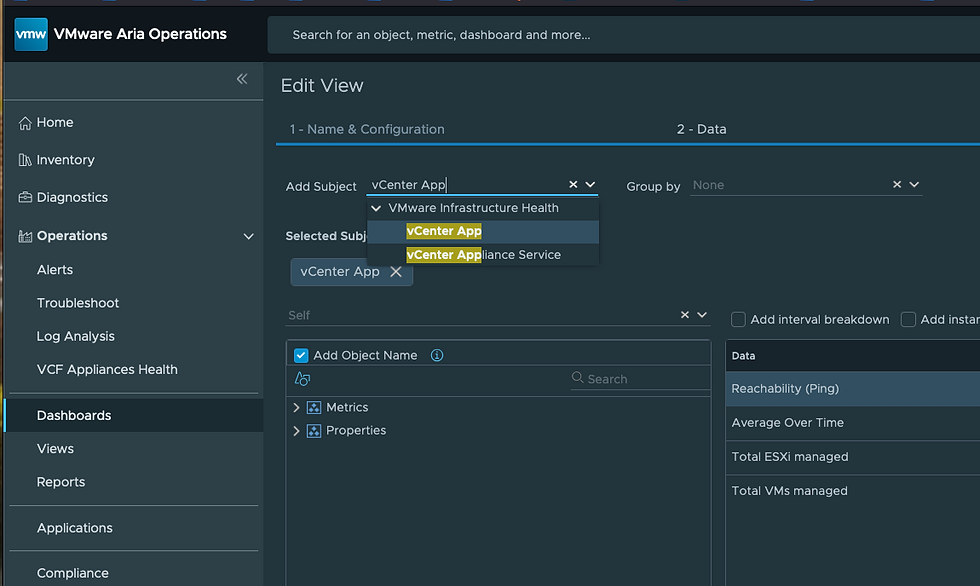
What's most interesting here is the vCenter App Object Type, where is this coming from? Several different ways to determine this, but if you start typing vCenter App in the Add Subject line it will tell you.

Looks like the VMware Infrastructure Health Management Pack is still running behind the scenes, it's just no longer available to be installed/configured (doesn't even show in Administration - Integrations - Repository).
Back to the vCenter Appliance Availability dashboard, once you've selected a vCenter on the left, the vCenter Services will show on the right.

Each vCenter Service has an Availability Metric (1=available, 0=not available), Health Property (HEALTHY | NOT HEALTHY), and Status Property (STARTED | NOT STARTED).
There is an Alert (vCenter app health is affect) that will trigger if/when any of these services goes down.
We now have clear visibility into vCenter Services and their health! I've cloned the default Dashboard (and Views), adjusted a few things, mine now looks like this.

You can download the Dashboard (and Views) from my GitHub Repo if you'd like, enjoy!


Are you running 8.18.2? I've noticed quite a few bugs on 8.18.1 (which is my current version)...I'm getting the "view cannot be rendered for object..." message under the vcsa appliance avail dashboard.