VMware Aria Operations 8.12 (and SaaS): What's New with Cost?!
- Brock Peterson

- Jul 4, 2023
- 1 min read
Updated: Dec 4, 2025
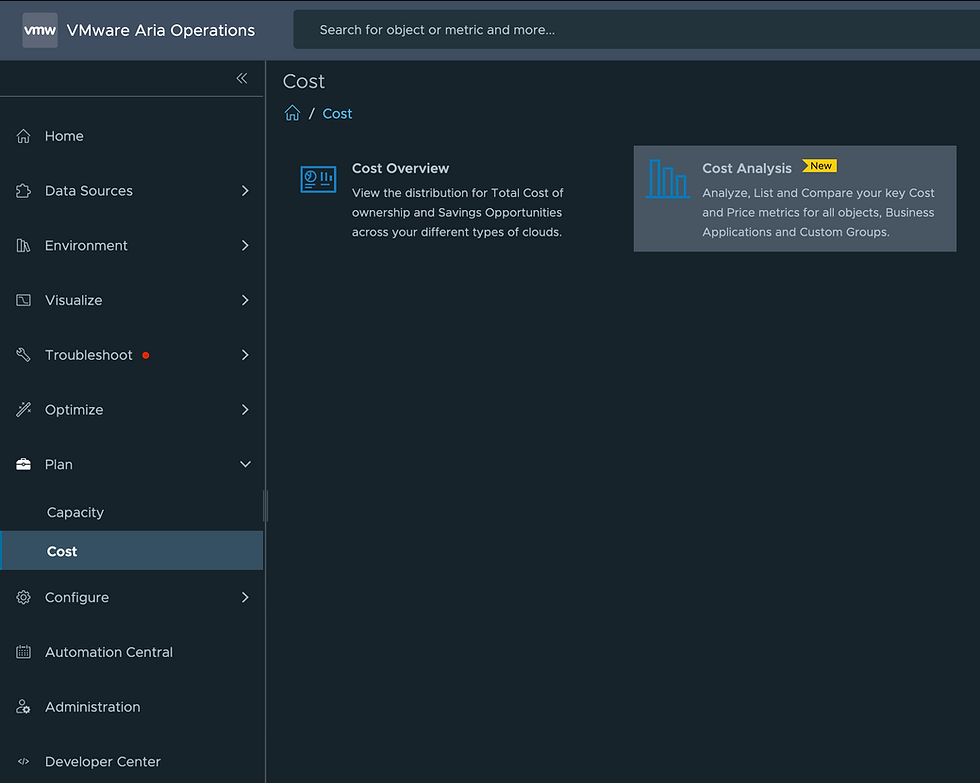
VMware Aria Operations 8.12 recently dropped, with all sorts of goodies! The announcement blog can be found here. Cost and Price have been around for several releases now, but Aria Operations 8.12 introduced the new Cost Analysis feature! Let's explore.

Selecting Cost Analysis gives us three options.

Let's start with the Cost tile, click ANALYSE

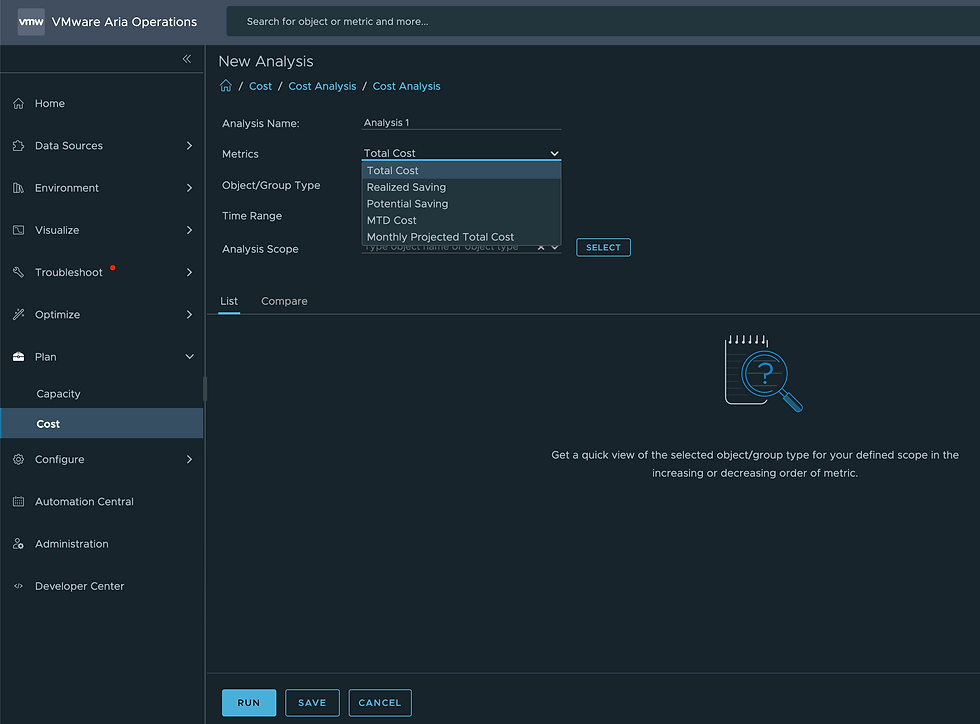
Give your Analysis a name, then select the metric you'd like to analyze from the Metrics dropdown, the Objects against which you'd like to perform your analysis, the time over which you'd like to perform it, and finally the scope.

Click RUN to perform the analysis.

The List tab output will be in two forms: first a graph representing the most expensive VMs last month, second a list of the most expensive VMs last month, in this case. Both are exportable as PDF and you have the option to adjust how many objects you are seeing via the List Size dropdown. Finally, you can save your analysis for future reference by clicking SAVE. Here you can see I have several of them, which I can run anytime, by clicking the three dots next to the Analysis and Run.

This provides a quick way to run costs analyses across your environment. The Price tile and the VMware Cloud Bills tile allow you to explore price and bills for those respective objects. For more information on Cost Analysis, documentation can be found here.
Comments