VMware vRealize Log Insight 102
- Brock Peterson

- Jan 1, 2021
- 3 min read
Updated: Apr 27, 2022
Last time we got vRealize Log Insight (vRLI) up and running. Today we'll look at administration of the platform. The version we are using here is vRLI 8.2.

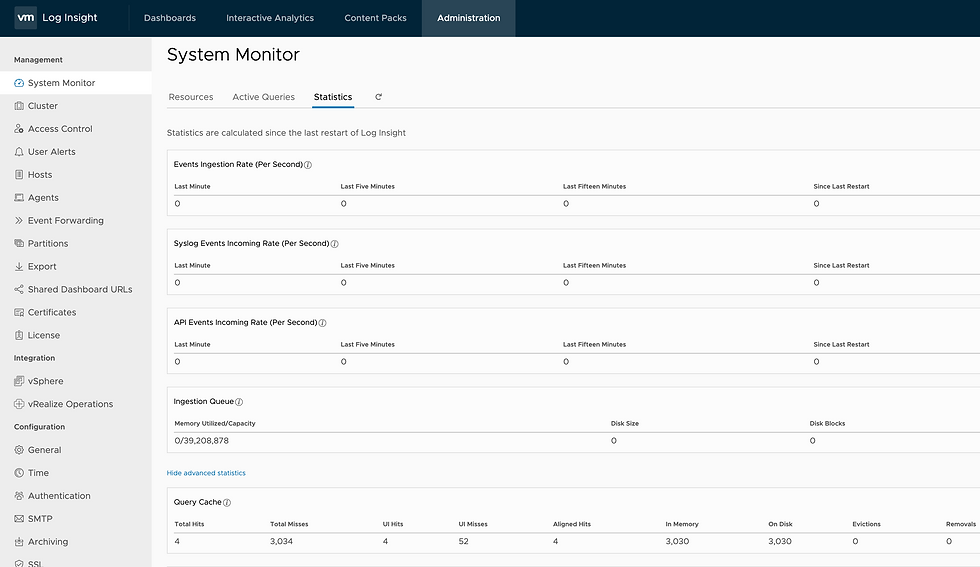
There are three distinct sections in the left hand pane: Management, Integration, and Configuration. Starting at the top, under Management, click System Monitor. It shows resources, active queries, and statistics for the vRLI cluster itself, updated every three seconds. Documentation is found here: https://docs.vmware.com/en/vRealize-Log-Insight/8.0/com.vmware.log-insight.administration.doc/GUID-FD4FCEE5-2EF6-4C73-9B37-B62850F6007D.html
The statistics tab is particularly interesting, it shows event ingestion rate, Syslog event incoming rate, API events, and more. This gives you visibility into the activity of your vRLI cluster.
Cluster details are next, they provide visibility into the Cluster itself, allowing you to upgrade vRLI, download support bundles, and activate the Integration Load Balancer (ILB) by configuration a Virtual IP (VIP) address.

Clicking the IP address shows vRLI Cluster details and allows you to restart vRLI itself.

This is also where you can configure the vRLI Integrated Load Balancer by adding a new virtual IP address. The information bubble provides some detail here.

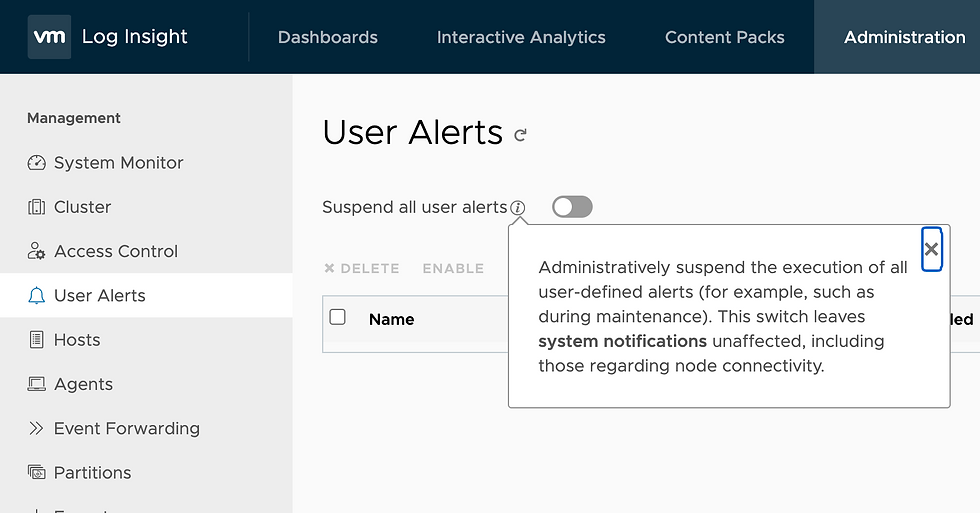
Access Control is just that, providing the ability to define users, roles, and data sets. The User Alerts tab gives the administrator the ability to suspend all user alerts.
The Hosts tab allows you to see all ESXi Hosts that are sending logs to vRLI. It also provides the ability to turn on notifications for inactive ESXi Hosts.

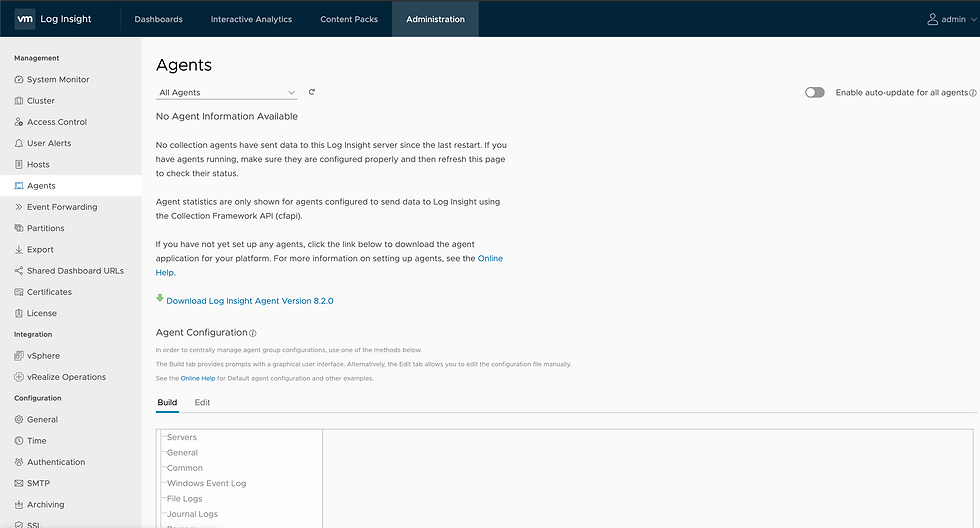
The Agents tab provides visibility into your vRLI agents, allowing you to enable auto-upgrades of agents, downloads of agents (Linux and Windows), and agent configuration. If you are using vRLI agents in your environment you will be spending a lot of time here.
Event Forwarding allows you to forward events to other vRLI or Syslog server destinations.

Partitions is a recent feature, introduced in vRLI 8.1. It allows users to partition logs into buckets with various retention periods. A detailed blog on this feature can be found here: https://blogs.vmware.com/management/2020/05/vrealize-log-insight-index-partitions-and-variable-retention-deep-dive.html
The Export tab provides a list of vRLI exports, say for example from Interactive Analysis. The Shared Dashboard URLs will provide a list of dashboards you're shared, including details of each dashboard. The Certificates tab will list details around certificates and who the provider is. The License tab will show vRLI licensing details.
Now, let's look at the second set of tabs in the left hand pane, Integrations. First, is vSphere. This will show the vCenter and ESXi Host integrations we set up previously.

Clicking the View details link for each vCenter will show details for the ESXi Hosts in that vCenter.

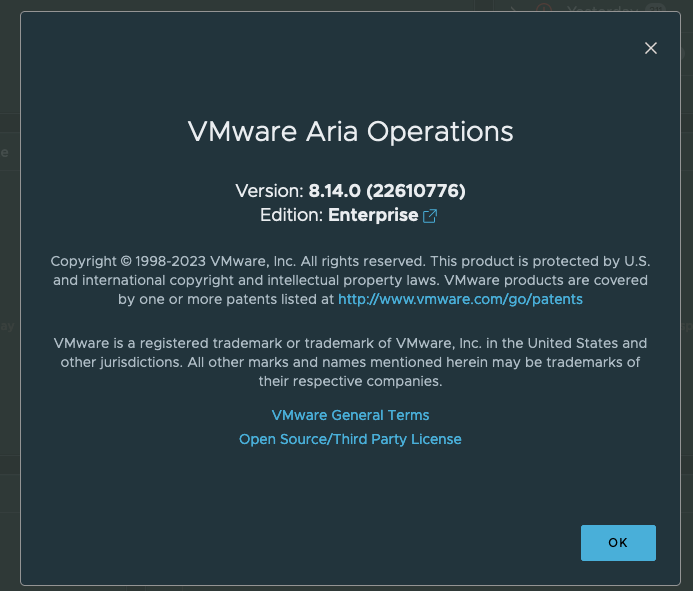
The vRealize Operations tab allows you to integrate vRLI with vROps. First, point it at your vROps Master Node, provide credentials, and test the connection. The user must have privileges to access the vROps REST API and manage resources in vROps. Configuration details from vRLI to vROps and vROps to vRLI is documented here: https://docs.vmware.com/en/vRealize-Operations-Manager/8.1/com.vmware.vcom.config.doc/GUID-33DAA688-CED8-4D24-8359-1FC1CEDD1191.html

You'll notice we have three check boxes available on the right hand side:
Enable alert integration - When enabled, vRLI user alerts can be sent to vROps. Alerts can be automatically mapped to a vROps object based on a vRLI field (e.g. hostname). This can be accomplished by creating a vRLI alert that groups by a field that vROps can recognize.
Enable launch in context - Launch in context allows vROps to open vRLI and query for selected object logs, and provides the ability for vRLI to navigate to the vROps object that generated the event. In practice, it looks like this:

3. Enable metric calculation - When enabled, vRLI can calculate and send metrics to vROps. Metrics can be automatically mapped to a vROps object based on a vRLI field (e.g. hostname). In practice, it looks like this:

The last grouping in the left hand pane is Configuration, it has six tabs.
General - allows for general configurations settings: where to send email alerts, where to sent HTTP Posts, retention periods, session timeout intervals, and more.
Time - NTP settings
Authentication - VMware Identify Manager (vIDM) and Active Directory
SMTP - SMTP server configurations: server, port, SSL, etc.
Archiving - data archiving
SSL - SSL configurations


Comments