Aria Operations Diagnostics Revisited
- Brock Peterson

- Dec 2, 2024
- 3 min read
Updated: Dec 17, 2025
Diagnostics was introduced in Aria Operations 8.18, which we've discussed previously. It's garnered a lot of attention since then, was updated in the most recent Aria Operations 8.18.2 release, and deserves an update, so here goes.

Let's discuss each of the 9 tiles, starting top left with Overall Findings. As the information bubble indicates: these are active findings based on properties and logs. To be a bit more specific they are based on two groups:
Properties captured by your vCenter/vSAN adapters, NSX Adapters, Aria Automation Adapters, and VCF Adapters
vCenter, ESXI Host, and SDDC Manager logs visible via the Aria Operations for Logs integration
For a list of all property and log based findings in Aria Operations 8.18.2 go here.

The property-based findings are things like vCenter versions and ESXi Host versions and are evaluated every 4 hours. The log signatures are run on-demand by clicking VIEW DETAILS - REFRESH FINDINGS.

Until you run REFESH FINDINGS manually, you won't see any log-based findings on the main page, but you will see property-based findings. There are 25 log-based findings in Operations 8.18.2, they can be found here. Overall Findings also includes Security Advisories, which is next.
The second tile shows Security Advisories based on properties/versions.

This will include VMSAs/CVEs only. All of the VMSAs/CVEs addressed in Operations 8.18.2 can be found here.

The third tile in the first row shows Certificates.

These are VCF related Certificates being captured by the built-in VMware Infrastructure Health (VIH) Management Pack. Including SSL, STS, and Root Certificates, but not intermediate Certificates. Something to remember here is that the vCenter Adapters require this permission in order to capture these Certificates.
Clicking VIEW DETAILS lists the Certificates (vCenter, SDDC Manager, Operations, Logs, NSX, etc), expiration dates, and more.

We've discussed Diagnostics Certificates previously, so I'm not going to go into much more detail here, but Certificate visibility is a powerful new feature in Operations 8.18 and beyond.
Starting in the second row, Diagnostics offers visibility into vCenters.

Clicking VIEW DASHBOARD takes you to a Dashboard listing vCenters you're collecting from, along with vCenter Services and their health.

These are also being created by the VIH Management Pack, for more details check out this blog. Something to remember here is that the vCenter Adapters require this permission.
The second tile in the second row shows Unresponsive ESXi Hosts: ESXi Hosts that have a Connection State of notResponding and aren't in Maintenance Mode.

Clicking VIEW DASHBOARD gives you a bit more detail, showing ESXi Hosts that are unresponsive, in maintenance mode, and with powered off or an unknown power state. These are all just properties being captured by your vCenter Adapters.
The third tile in the second row shows Workload Provisioning activities.

Clicking VIEW DETAILS shows all VM provisioning requests and failures.

These are generated by vCenter Tasks and Events being pulled into Operations by your vCenter Adapters.
Finally, in the bottom row of Operations Diagnostics, we'll explore vMotions, VM Snapshots, and vSAN Clusters.

Clicking VIEW DETAILS in the vMotions tile gives you details around vMotion successes and vMotion failures over time, which are based on vCenter Tasks/Events collected by your vCenter Adapters.

The table entries are based on vSphere Events being collected by Aria Operations for Logs. Details of each vMotion are also captured from vCenter Logs via Aria Operations for Logs.
The second tile in the last row is Snapshots, which details VM Snapshots.

These are based on vCenter Tasks and metrics/properties being pulled into Operations by your vCenter Adapters.
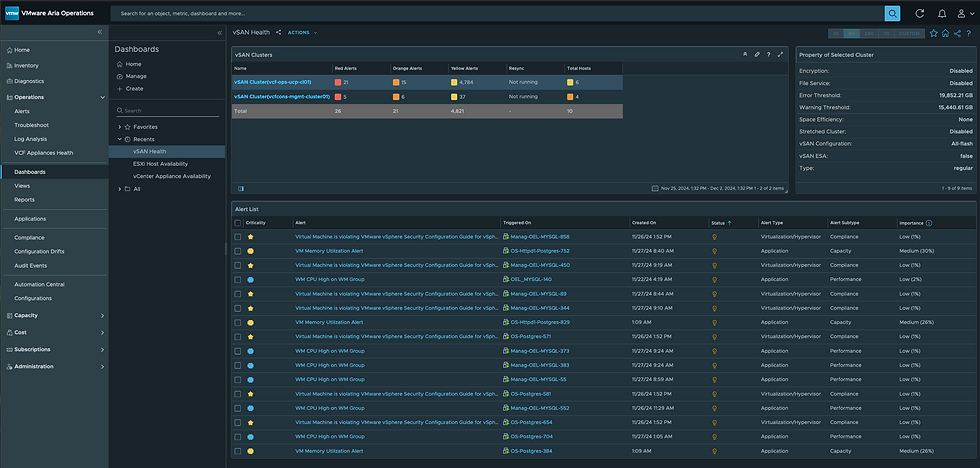
Finally, vSAN Clusters is the last tile in the bunch and shows vSAN Clusters with Issues.

Clicking the VIEW DASHBOARD link gives you details.

All of these are objects, object types, metrics, and properties being captured by your vCenter Adapters. Going forward, Diagnostics updates will be provided at release time and as necessary to address critical VMSAs/CVEs or any other critical issues.
Comments