Cluster Availability % in Aria Operations
- Brock Peterson

- May 2, 2025
- 1 min read
Updated: Aug 23, 2025
Looking to determine vSphere Cluster availability in Aria Operations? We introduced a metric called Cluster Availability (%) back in Operations 8.16, here's how it works.

Cluster Availability (%) is a computed metric, the formula can be found in /usr/lib/vmware-vcops/user/plugins/inbound/vmwarevi_adapter3/conf/describe.xml.
Looking there you'll find the following:
<ComputedMetric expression="min([100,${this, metric=summary|number_running_hosts}/(${this, metric=summary|total_number_hosts})*100])" key="summary|cluster_availability"/>As you can see Cluster Availability (%) is (Running Hosts / Total Hosts ) * 100, so in a 4 node Cluster, if there are 4 ESXi Hosts and 1 of them is down, the Cluster Availability (%) will be 75%. This is a point in time metric, it doesn't track availability over time.
Now, if you want to pull this metric from the Operations API, you can do so with GET /api/resources/{id}/stats, something like this:
curl -X GET "https://10.167.244.218/suite-api/api/resources/14685df0-81c3-44f5-8193-da5b0d6d06ff/stats?resourceId=&statKey=summary%7Ccluster_availability&_no_links=true" -H "accept: application/json" -H "Authorization: OpsToken 98c5b2a0-1517-4104-9895-fd3faf5b77cc::53267957-d171-4a42-942f-289b8dc29cb7"The Swagger call looks like this.

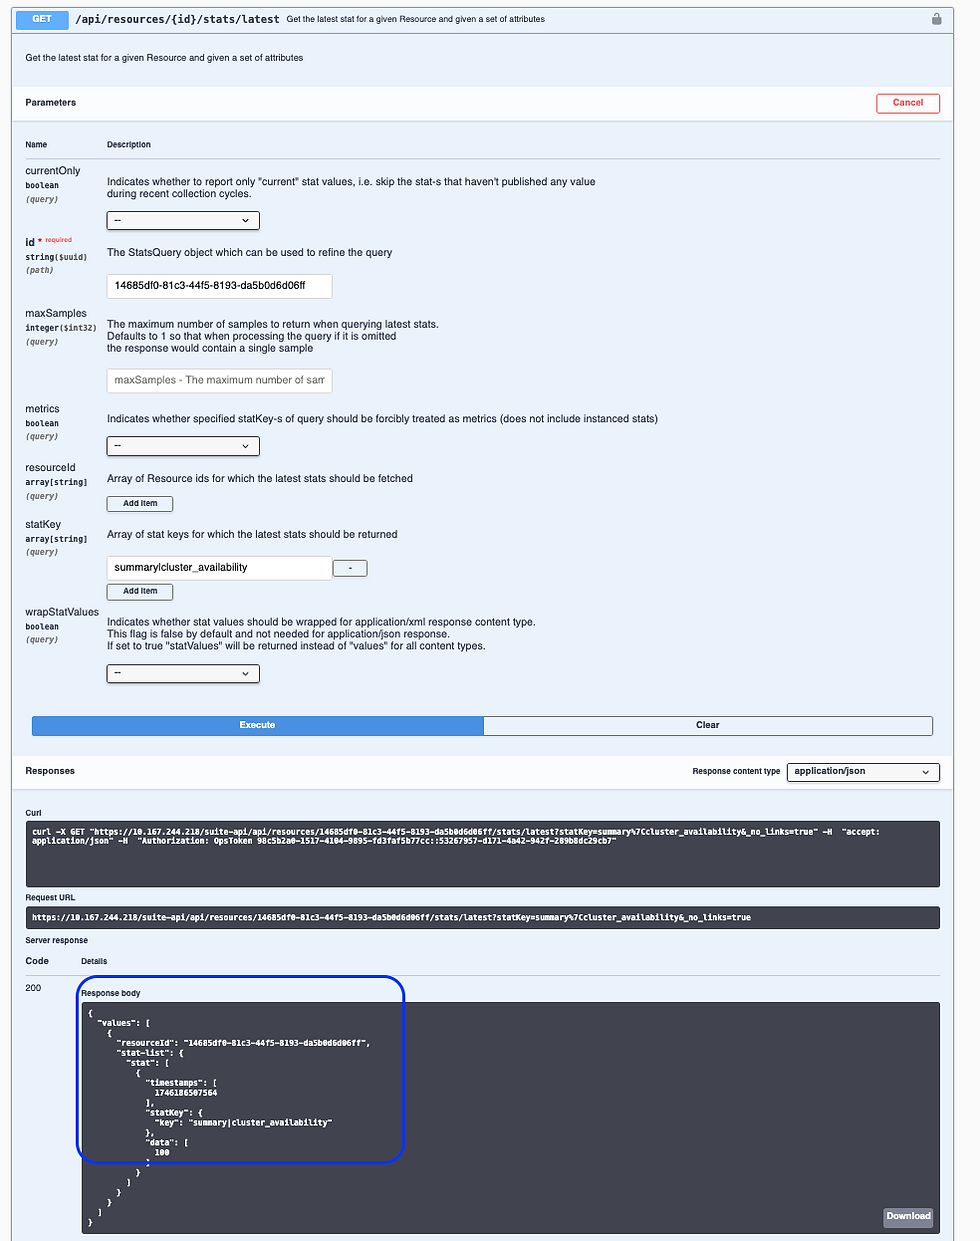
If you want just the latest value of the metric, run this: GET /api/resources/{id}/stats/latest.


Comments