VCF Operations 9.1 Dashboard and View Enhancements
- Brock Peterson

- 27 minutes ago
- 2 min read
VCF 9.1 dropped a couple weeks ago, with all sorts of goodies! Over the next few weeks I'll highlight the updates, we'll start today with what's new in Operations Dashboards and Views, here's a Summary:
Dashboard Performance and Scalability Improvements
Dashboard Sections
Widget Descriptions and View Details Button
Visual Enhancements
New PromQL Viewer Widget
Manage View Enhancement supporting filtering by Metrics/Properties
Trend View Enhancement supporting sorting
First, Dashboard Performance and Scalability has been improved by storing Dashboards in a Relational Database as opposed to a Key-Value Store Database. This leads to faster Dashboard loading, creation, editing, and more.
Second, let's explore the details of Dashboards Sections, they look like this.

Click ADD SECTION at the bottom of your Dashboard editor which will add a SECTION at the top. You can add additional Sections and drag them wherever you want. Once added click the notepad/pencil icon to edit the Section, I've adjusted mine to look like this.
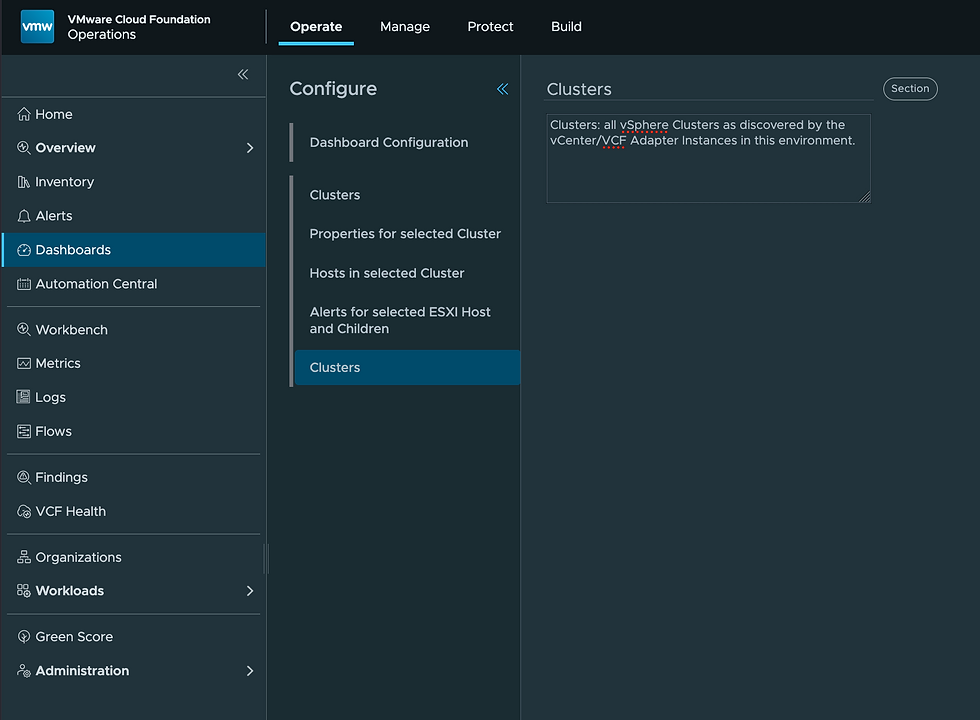
Once added to the Dashboard it will look like this.

Clicking the Clusters Section Information bubble at the top gives the description you previously provided. This is a great way to help with Dashboard descriptions, navigation, groupings, and more.
The third item is the Widget Descriptions and View Details enhancement. In your Dashboards you now have the ability to provide a Description and URL for each Widget, like this.

In your Dashboard it will look like this.

The Information bubble in the title bar gives the Description and the VIEW DETAILS link at the bottom of that widget sends the user to the URL provided. This can help with descriptions, navigation, and documentation.
The fourth item is Visual Enhancements. This is referencing the implementation of the Clarity Design industry standard color palette. We improved the visualization of Trend View (Pie Chart) as well.

The fifth item is the new PromQL Viewer Widget available for use in Dashboards. This is the Widget to be used with Real-Time Metrics (those with 20-second data points). An example would look like this.
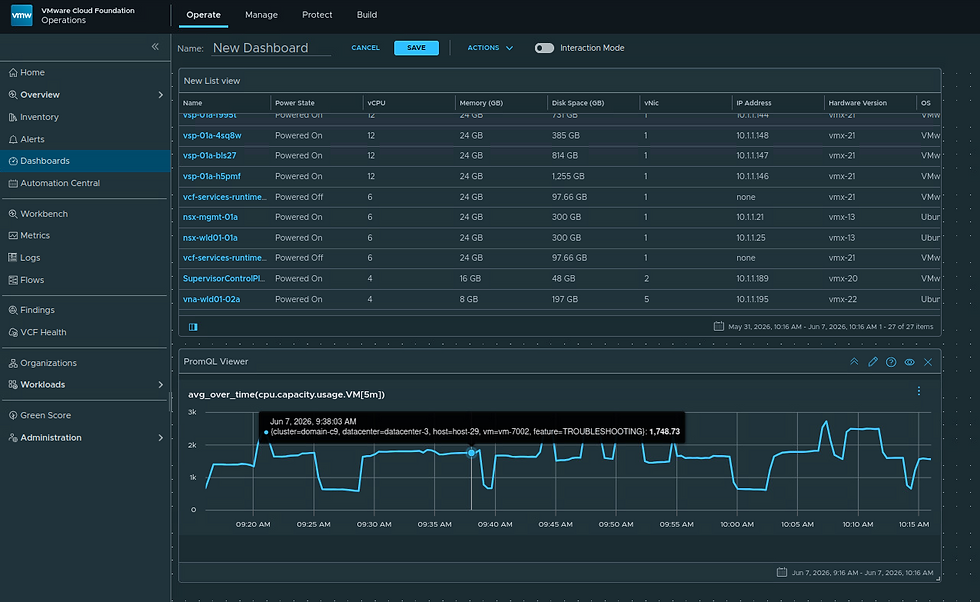
As you hover over the PromQL Viewer chart you'll notice the 20-second data points.
The configuration of the PromQL Viewer Widget in this Dashboard looks like this.

I'll have an upcoming blog that will dig into the details of Real-Time Metrics and the PromQL Viewer Widget specifically, I just wanted to highlight it here.
The sixth improvement is an improvement to the Views Manage UI. Users can now filter Views based on Metrics/Properties as shown here.

The final improvement is Trend View Enhancement supporting sorting, which looks like this.

Previously the objects were listed at the bottom in alphabetical order, they can now be listed in ascending/descending order (according to metric value) to go along with what is shown in the chart itself.
Some great new stuff in VCF Operations 9.1, hope this was helpful!


Comments